Dejuan Washington Projects

Showcasing my data visualization skills in finance.

This is my Excel project that I clean and organize the data and made a visualization.

Projects

Showcasing my data analysis work.
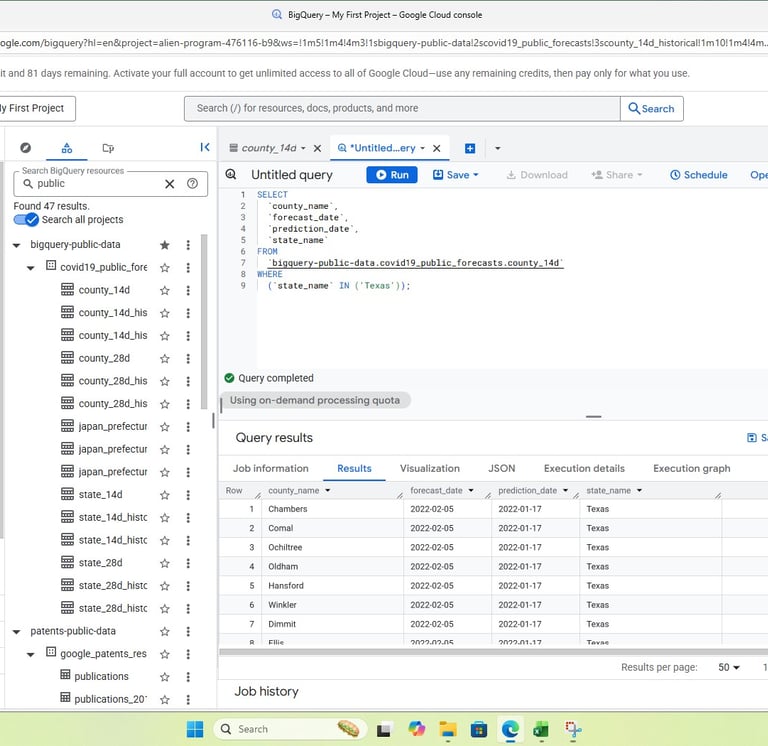
Analysis

In-depth financial data insights.
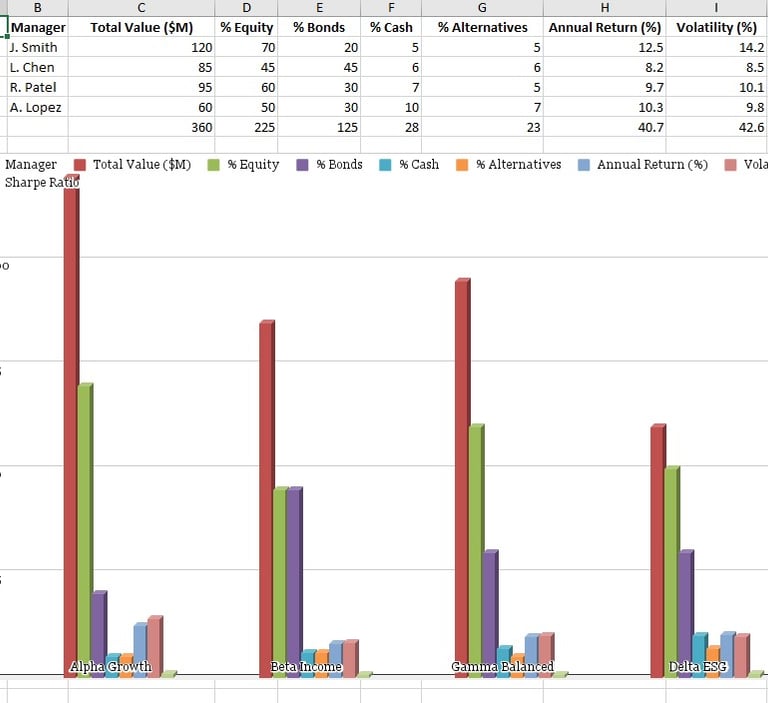
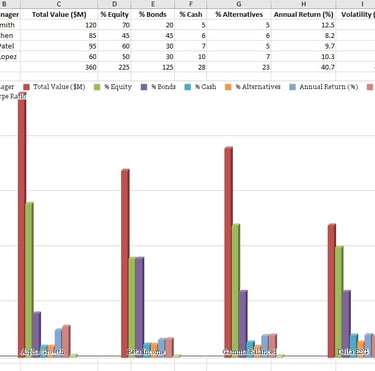
A pie chart representing budget allocations.
A bar graph comparing quarterly earnings.
Visualization

Creative data representation techniques.
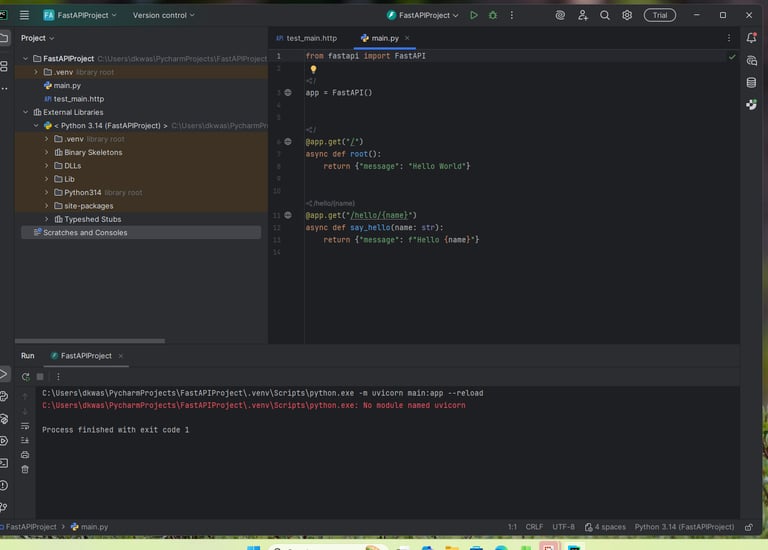
Experience

I have worked on various data analysis projects.

Focused on finance.

Google Coursera Certification Data Analytics

Coursera

2025

Learned in depth on the job skills of a Data Analyst.

A professional workspace showcasing data analysis tools.

Gallery

Explore my data visualization projects

A colorful bar chart showcasing financial data trends.
A line graph depicting stock price movements over time.
A heatmap representing data correlation in finance.
An interactive dashboard displaying key financial metrics.

Contact

A professional contact form layout for inquiries.

Get in touch to discuss projects and opportunities.